Understanding the Difference Between Correlation and Dependence
- Soheil Radfar
- Nov 24, 2024
- 3 min read

The Language of Relationship
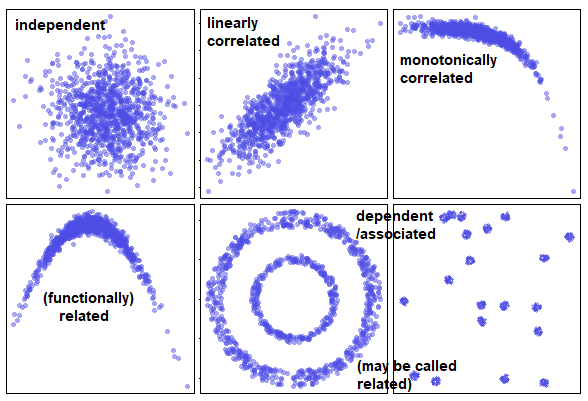
Have you ever wondered about the subtle differences between "correlation" and "dependence"? While these terms are often used interchangeably in everyday language, they hold distinct meanings in the realm of statistics and data analysis. Understanding these concepts is crucial in many fields where analyzing relationships between variables can significantly impact decision-making and system design.
Moving to Statistics: A Tale of Two Concepts
The Broader Picture: Dependence
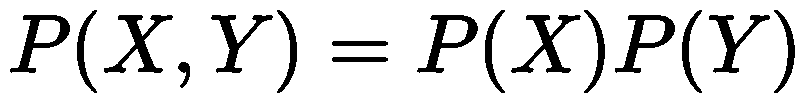
In statistics, dependence (or statistical dependence) is the broader concept. Two random variables X and Y are dependent if knowing the value of one provides information about the other. Mathematically, this is expressed through probability:
X and Y are independent if and only if:

or equivalently
The Special Case: Correlation
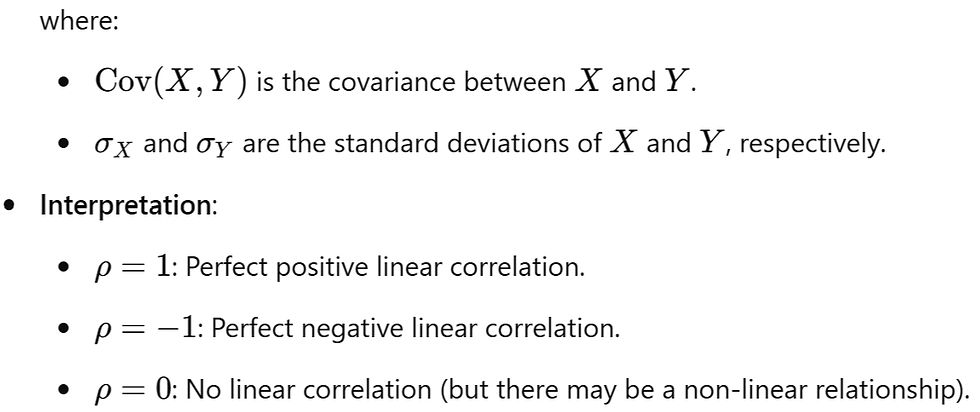
Correlation is a specific type of dependence that measures linear relationships between variables. The most common measure is the Pearson correlation coefficient (ρ):

Illustrative Examples
Example 1: Dependent but Uncorrelated Variables
Consider two variables, X and Y, where Y is equal to X squared
Data:
X: −3, −2, −1, 1, 2, 3
Y: 9, 4, 1, 1, 4, 9
Analysis:
The Pearson correlation coefficient ρ is calculated to be zero.
Despite ρ=0, Y is completely dependent on X through a non-linear relationship (Y=X^2).
Plotting X vs. Y yields a parabolic curve, highlighting the non-linear dependence.
Example 2: Correlated Variables
Let Y=2X+ε, where ε is a random error term with mean zero.
Analysis:
The relationship between X and Y is linear.
The Pearson correlation coefficient ρ will be close to 1, indicating a strong positive linear correlation.
Here, X and Y are both dependent and correlated.
The Curious Case of Spearman's Rank Correlation
A fascinating detail that often causes confusion is why we call Spearman's coefficient a "correlation" when it can capture non-linear dependencies. Here's why:
It first converts values to ranks
Then applies Pearson's correlation to these ranks
This transformation "linearizes" monotonic relationships
For example:
Data:
X: 1, 2, 3, 4, 5
Y: 1, 4, 9, 16, 25
Analysis:
Ranks for both: 1, 2, 3, 4, 5
The relationship between ranks becomes linear, even though the original relationship was quadratic!
The Key Insight
What makes this interesting is that Spearman's correlation isn't truly measuring non-linear dependencies - it's measuring linear relationships between ranks! This transformation allows it to capture monotonic relationships (consistently increasing or decreasing), whether they're linear or non-linear in the original data.
Limitations
While this makes Spearman's correlation more robust than Pearson's, it still has limitations:
Only captures monotonic relationships
Cannot detect complex patterns like sinusoidal relationships
Loses information about the magnitude of differences between values
This is why for complex dependencies, we often need more sophisticated tools like Copulas (for complex dependency structures), Mutual information (for general statistical dependence), and Neural networks (for complex pattern recognition).
Key Takeaways
Correlation is a subset of dependence
Correlated variables are always dependent, but dependent variables aren't always correlated
Spearman's correlation captures monotonic relationships through rank transformation
Real-world relationships often require more sophisticated tools than correlation
Understanding these distinctions is crucial for proper system design and analysis
Understanding the distinction between correlation and dependence enhances our ability to analyze data accurately. While correlation is a valuable tool for detecting linear relationships, acknowledging dependence—especially non-linear—is essential for comprehensive analysis and informed decision-making.
Comments